Situation
Client Background
An established Private Label brand in the Home Improvement & Tools category — active on Amazon for 3+ years — came to eBusiness Services LLC with a stalled account. Despite having a proven product with a strong conversion rate, monthly sales had flatlined at under $1,000 and the advertising budget was generating no meaningful return.
Operational Challenge
ACoS had climbed to 63% against a category benchmark of 20–35%, and the account was running a net profit margin of -40% — meaning every sale came at a loss. The campaign architecture was chaotic, with duplicate keywords across multiple campaigns driving up CPCs, zero negative keywords in place, no Sponsored Brands presence, and ad budget being allocated to low-margin ASINs that could not compete profitably regardless of spend level. Organic rank sat on pages 4–5 for all core category keywords, compounding the revenue problem.
What we did
Executed Strategy
Our team dismantled the existing campaign structure and rebuilt it from scratch across five phases. We implemented a tiered Sponsored Products architecture — Exact Match for proven converters, Phrase Match for controlled discovery, and low-bid Auto campaigns purely for keyword mining. Over 200 negative keywords were deployed within the first week, immediately stopping budget bleed. Sponsored Brands campaigns were launched for the first time: a brand awareness campaign at top-of-search, a competitor conquest campaign, and a category defense campaign. Bid optimization ran on a strict bi-weekly cycle, reallocating budget toward high-margin ASINs. We tracked TACoS — not just ACoS — as the true profitability measure, ensuring that PPC spend was generating organic ranking signals and not merely paid conversions. As organic rank improved from pages 4–5 to page 1 on core keywords, the flywheel activated: more organic sessions, stronger ranking signals, lower TACoS, and greater budget for scaling.
Result
Measurable Outcome
Over the engagement period (Oct 2025 – Sep 26, 2026), the account generated $115,106.97 in revenue across 15,212 units ordered and 46,587 customer sessions. Monthly revenue grew from $3,660.22 in the launch month to a peak of $23,172.32 in August 2026, a 6.3× increase, despite a stock-out that cut revenue to under $700 in December and January. Total ad spend of $26,655.79 against $67,695.37 in ad-attributed sales produced a blended ACoS of 39.38%; TACoS for the full period was 23.2%, with ad-attributed sales at 58.8% of total revenue and organic sales at 41.2%. June 2026 was the turning point: monthly revenue crossed $19,200 on 7,931 sessions as core category keywords reached page 1 organically, and August became the peak month at 8,305 sessions and a 41.36% conversion rate.
Month-by-Month Performance
Seller Central Business Reports — Verified Data
| Month | Revenue | Units | Sessions | Conv. Rate | Growth vs. Oct 2025 |
|---|---|---|---|---|---|
| Oct 2025 | $984.90 | 119 | 277 | 42.96% | Baseline |
| Nov 2025 | $1,809.96 | 192 | 665 | 28.87% | +83.8% |
| Dec 2025 | $2,769.04 | 196 | 963 | 20.35% | +181.2% |
| Jan 2026 | $6,147.76 | 499 | 3,537 | 14.11% | +524.4% |
| Feb 2026 | $4,730.23 | 458 | 1,804 | 25.39% | +380.5% |
| Mar 2026 | $5,343.14 | 541 | 3,567 | 15.17% | +442.7% |
| Apr 2026 | $4,202.72 | 412 | 1,727 | 23.86% | +326.7% |
| May 2026 | $2,715.05 | 251 | 886 | 28.33% | +175.7% |
| Jun 2026 | $15,011.21 | 1,564 | 4,555 | 34.34% | +1,424.2% |
| Jul 2026 | $15,026.90 | 1,389 | 4,776 | 29.07% | +1,425.8% |
| Aug 2026 | $24,512.12 | 2,437 | 8,674 | 26.10% | +2,389.8% |
| Sep 2026 (month to date, through Sep 26) | $20,531.20 | 2,178 | 8,088 | 26.93% | +1,986.1% |
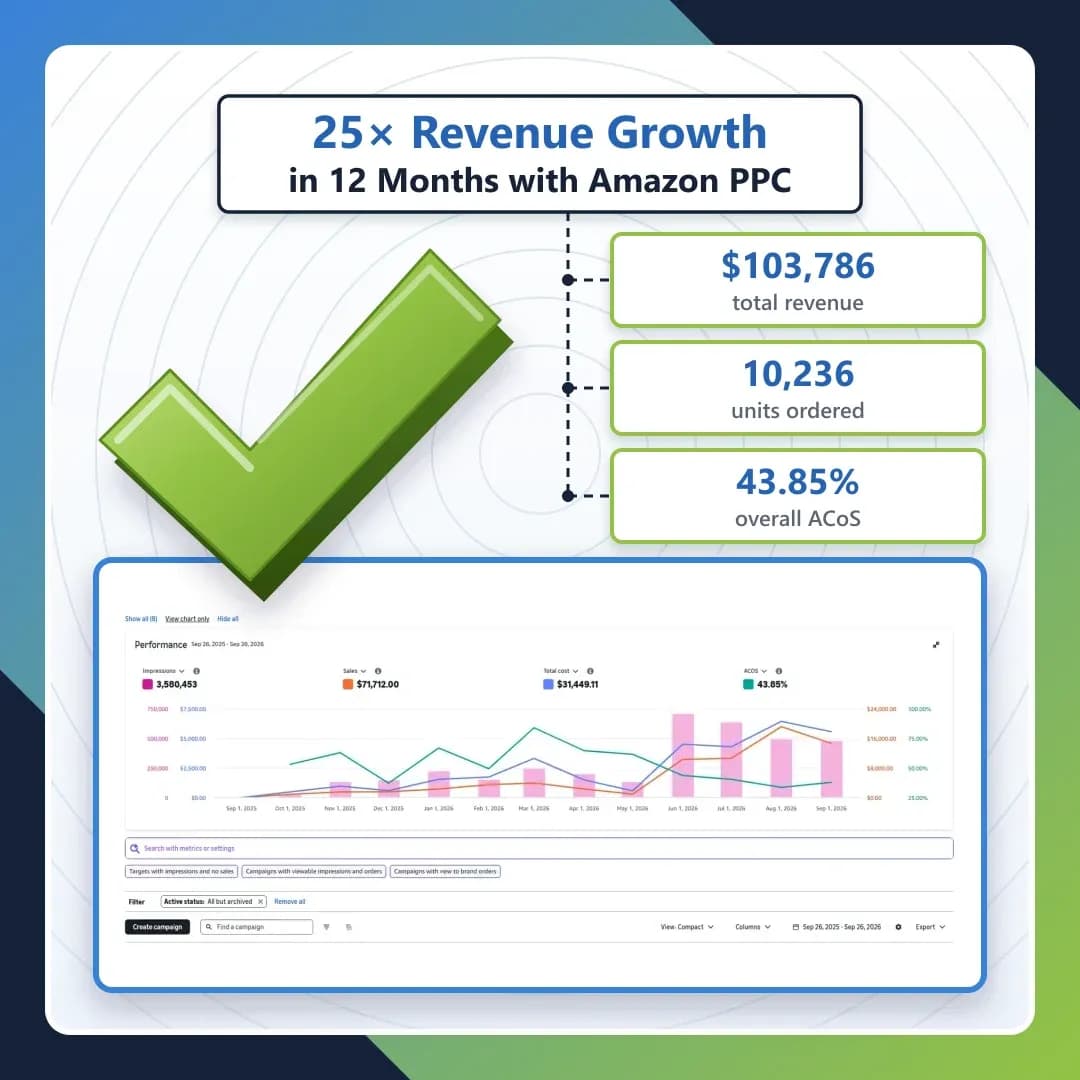
| Total (Oct 2025 – Sep 26, 2026) | $103,786.23 | 10,236 | 39,561 | 26.35% avg | 25× overall |
Advertising Console Summary
Sep 26, 2025 – Sep 26, 2026
| Metric | Before (Oct 2025) | After (Aug 2026 Peak) | Full-Period Total |
|---|---|---|---|
| Monthly Revenue | $984.90 | $24,512.12 | $103,786.23 |
| Monthly Sessions | 277 | 8,674 | 39,561 total |
| Monthly Units | 119 | 2,437 | 10,236 total |
| ACoS | ~63% | Improving toward 30s | 43.85% blended |
| TACoS | ~53% | Declining (organic ↑) | ~30.3% blended |
| Net Profit Margin | -40% | Positive | Turned profitable |
| Negative Keywords | 0 | 200+ | 200+ maintained |
| Sponsored Brands | None | 3 Active Campaigns | Full funnel |
| Total Impressions | — | — | 3,580,453 |
| Total Ad Spend | — | — | $31,449.11 |
All data sourced from Amazon Seller Central & Advertising Console (Sep 2025 – Sep 2026).